

How to Choose the Best Conductivity Meter in 2026?
Choosing the best conductivity meter in 2026 starts with the sample, not the feature list. A freshwater aquarium, boiler feed line, and high-purity water system need different measurement ranges and probe designs. Temperature matters, too. A reading can shift when a sample warms, even if its composition stays unchanged. Small details matter.
Electrical measurement pioneer William Thomson, known as Lord Kelvin, wrote, “When you can measure what you are speaking about, and express it in numbers, you know something about it.” That principle still applies to every conductivity meter. Reliable results depend on more than a clear digital display. Check the instrument’s range, accuracy, temperature compensation, cell constant, and calibration requirements. Then compare those specifications with your actual samples and working conditions.
A practical test can reveal what a brochure cannot. Hold the probe in a calibration solution, watch the reading settle, and note how easily the cell rinses afterward. If staff move between samples, simple calibration and a durable, easy-to-clean probe may matter more than extra features. For continuous monitoring, data logging and alarm options may deserve closer attention. But there is no perfect meter for every job. A feature that helps in a water-treatment plant may add cost without value in a small teaching lab. Review the manufacturer’s documentation, confirm service support, and consider who will use the instrument each day. The choice should fit both the measurement and the people making it.
Understand What a Conductivity Meter Measures
How to Choose the Best Conductivity Meter in 2026?
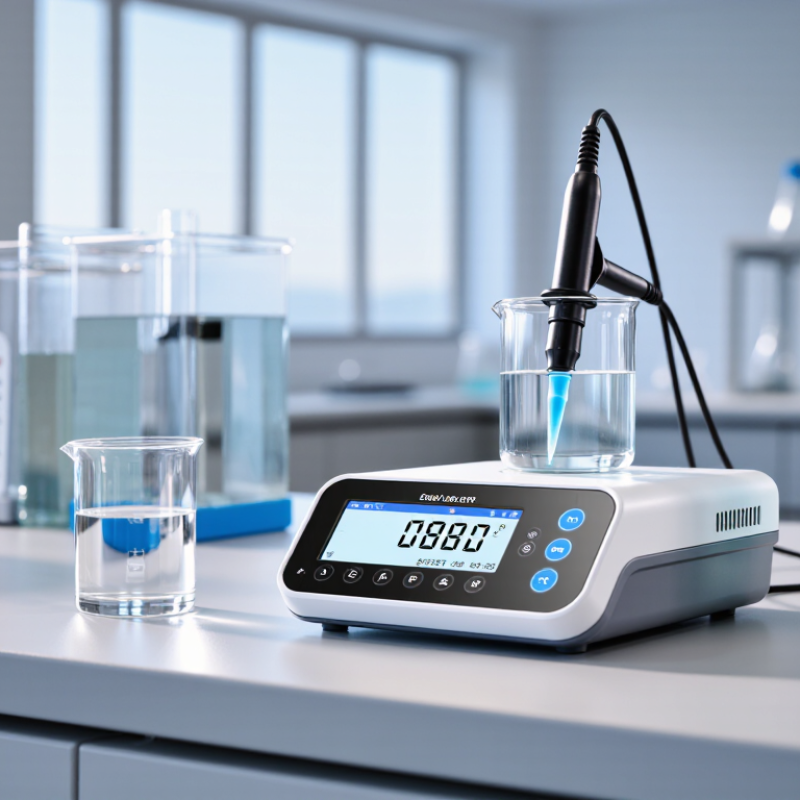
A conductivity meter measures how easily an aqueous solution carries electrical current. Dissolved ions, such as salts and minerals, help conduct that current. More mobile ions often mean higher conductivity, but the reading does not identify which substances are present. It is not a complete chemical analysis. For example, a meter can show that tap water conducts better than distilled water, but it cannot tell you exactly which minerals caused the difference. That distinction matters when selecting a meter for water checks, laboratory work, or process monitoring.
Tips: Match the meter’s range and resolution to your samples. Check whether it supports temperature compensation, since conductivity changes as a solution warms or cools. Many readings are referenced to 25°C, but automatic compensation does not correct every sample perfectly. Calibrate with an appropriate standard, rinse the probe between samples, and avoid touching its sensing surfaces. Small habits matter.
Consider the probe’s cell constant, cleaning needs, and replacement availability, not just the display. A compact meter may suit quick field checks; repeated measurements in a controlled lab may call for greater stability and data logging. Keep sample temperature and handling consistent when comparing results. A reading can look precise while still being misleading if the probe is dirty or calibration is overdue. The inconvenient part: no single meter is best for every solution. Choose around the actual sample and decision, then verify performance with standards.
How to Choose the Best Conductivity Meter in 2026? — Understand What a Conductivity Meter Measures
| Selection factor | What it measures or means | Practical guidance | Example or consideration |
|---|---|---|---|
| Electrical conductivity (EC) | A measure of how readily a liquid conducts electricity, mainly due to dissolved ions. | Choose a meter whose measurement range covers the expected sample values with useful resolution. | Common units are µS/cm and mS/cm; 1 mS/cm equals 1,000 µS/cm. |
| What EC does not identify | Conductivity indicates the combined ionic contribution, not which specific ions are present. | Use a suitable chemical analysis method when the identity or concentration of individual ions is required. | Two samples with different dissolved ions can have similar conductivity. |
| Expected sample range | The approximate conductivity range of the water or solution being tested. | Match the meter and probe range to the sample; check the manufacturer’s stated range and accuracy. | At 25°C, theoretical ultrapure water is about 0.055 µS/cm, while seawater is commonly around 50–55 mS/cm. Actual values vary by sample and conditions. |
| Probe cell constant | A probe characteristic that relates its electrode geometry to the conductivity measurement. | Lower cell constants, such as K = 0.1 cm−1, are generally used for low-conductivity samples; K = 1 cm−1 is common for general-purpose work; higher constants, such as K = 10 cm−1, are often used for higher-conductivity samples. | Confirm that the probe’s cell constant and range are compatible with the meter and sample. |
| Temperature measurement and compensation | Conductivity changes with temperature, so the measured temperature helps interpret results. | For comparable readings, use a meter with a temperature sensor and select an appropriate compensation setting for the sample. | Automatic temperature compensation adjusts a reading using a selected model; it does not make every solution’s temperature response identical. |
| Reference temperature | The temperature to which a compensated conductivity result is reported. | Check the reference temperature used by the instrument and keep it consistent when comparing results. | 25°C is a commonly used reference temperature, but specific procedures may require another value. |
| Calibration | Adjustment or verification of the measuring system using conductivity standards with known values. | Choose a meter that supports standards covering the sample range, and follow the instrument and method instructions. | Use fresh, uncontaminated standards and rinse the probe as directed between solutions. |
| Resolution and accuracy | Resolution is the smallest displayed change; accuracy describes how close a result is to the true value. | Check both specifications at the conductivity range and temperature relevant to your work. | A display with many digits does not, by itself, guarantee high accuracy. |
| Sample and probe handling | Probe condition, contamination, bubbles, and sample handling can affect readings. | Select a probe suitable for the sample and workflow; follow cleaning, storage, and rinsing instructions. | Allow the reading to stabilize and ensure the sensing area is properly immersed. |
| TDS conversion | Total dissolved solids (TDS) may be estimated from conductivity using a conversion factor. | If TDS is needed, check the conversion factor and method used; treat the result as an estimate unless validated for the sample. | The relationship between conductivity and TDS varies with the ionic composition of the solution. |
| Data and operating features | Features such as data logging, connectivity, display readability, and portability affect day-to-day use. | Prioritize features that match your documentation, field, or laboratory requirements. | For regulated or quality-controlled work, consider whether the meter supports the required records and procedures. |
Note: Example conductivity values are approximate and depend on temperature, composition, and measurement conditions. Consult the applicable method and instrument documentation for specific requirements.
Related Posts
-

What is a Conductivity Meter and How Does it Work?
-

2025 Top Conductivity Meters for Accurate Water Quality Measurement
-
Why is a conductivity meter important in water testing?
-
2026 How to Choose the Best Conductivity Meter for Your Needs?
-
Top 10 Conductivity Meters for Accurate Measurements?
-
Top 10 Conductivity Meters for Accurate Water Quality Testing